Visual Decision Making - GIS

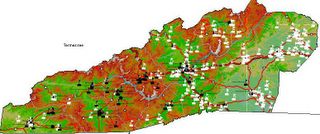
Learning, understanding and problem solving have a very high visual component. GIS stands for Geographic Information Systems, applications which compose maps of relationships as easily as one would compose a paragraph. These relationships are as basic as the above map of schools in western North Carolina or a state highway map and as complex as multiple layers of a community’s infrastructure of pipes, wires, roads and buildings. Deeper understanding of GIS begins with learning more examples of applications and the elements of a GIS map. GIS plays a significant role in problem solving at both the Look and Evoke stage of the LEAP model.
GIS software enables a user to build maps in layers and to search data which can be displayed as relationships among the data on the map. Applications range from desktop computer tools such as ArcView by ESRI to web server map systems such as provided by maps.google.com, earth.google.com/, maps.yahoo.com and http://www.mapquest.com/, terraserver.microsoft.com/ and http://terraserver.microsoft.com/. All play an important role in data driven decision making. See this example of mapped criminal activity in Chicago and imagine the use of this information by both police and local citizens.
Study a free GIS program. Use it to compose your own maps, and explore its tutorials as a next step in understanding the power and functionality of GIS software.

Comments