At the Heart of Creativity
As financially starved public educational systems in the U.S. slowly turn to find culture's new digital direction, there is a deeper shift happening. There is a shift in the world's awareness, a shift from a linear (graph on left) to a nonlinear view of how things interact and develop. This shift requires an intuition about exponential behavior for which it has so far demonstrated considerable ineptitude (Bartlett, 2005). Why is it that nonlinearity tends to create surprise at the speed in which apparent slow growth becomes dramatically different? Surviving, let alone thriving, may be more connected to solving this problem of understanding than we yet appreciate.
So little of the patterns of this now well defined logic and mathematical knowledge (Houghton, 1989/2009) is widely known. In fact, such ideas are central to motivating the application of the public's newly found and growing interest and struggle with the teaching and practice of the pinnacle of higher order thinking, creativity (Hodgson, 2012; Bellanca, Fogarty & Pete, 2012). It is worth noting that creativity, does not stand in isolation; it requires the cumulative underpinnings of the other higher order skills.

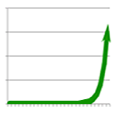
A small step in the appreciation of exponential behavior might begin with a change in its iconic representation. Exponential thinking is often expressed as an upward rising curve, the classic hockey stick graphic of the population curve. Even that is often truncated, cutting off the long boring space-consuming reality of the slowly rising line of the graph. A mere 7 million prior years are missing in the graph on the left. Instead the more visually interesting is generally shown, the last sharply upturning few percent of a long period of development (graph on right). If we change the scale to show the full range of the horizontal 7 million years, the upturn of the graph looks insignificant.
Returning to the long hockey stick graph above, if one were positioned at the year 1700, and had accurate data for the previous several hundred years it would seem logical to conclude that the past tells the future. What mathematical education has apparently provided many is the idea that change is additive. If you add something this year, 2, to the number from last year, 8, the result is 10 and the pattern would continue, 12, 14, 16 etc. The result is a straight-line graph and simple prediction about a situation somewhere in the future. Exponential change multiplies not adds. What has become common in the faster paced 21st century is the idea of doubling. Multiple by 2 each year and the skips between numbers grow rapidly. If you multiple 2 x 4, you get 8, which times 2 is 16, which times 2 is 32, times 2 is 64. Each interval of change is significantly greater than before. This is still a simple math but one that leads to very different thinking about the future.
If given the choice of a million dollars, or doubling an initial dollar every day for a 31 day month (R x 2 or Rx2), choosing the million dollars would result in almost a billion less than the choice of starting small but multiplying it multiple times. Actually writing down the numbers to see their increasingly larger jumps in size is an educational event worthy of your time.
Beyond simple math, change also becomes radically different when an invention changes the multiples. When the right special thing happens, however seemingly minor it might be at the time, radical change quickly builds. In the case of the human population graph, human power is capable of .1 horse power (hp) almost indefinitely and 1.2 hp for very short bursts. James Watt's moment of creativity stretched the capacity of existing steam engines to a reliable 10 hp in 1771, opening door to further invention that would become 1,000 times greater in a century ("horse power", 2014). This change was a major factor in birthing the industrial age whose machines enabled one person to do the work of an increasingly larger number of workers. It was this result that enabled the creation of food and goods to supply a population explosion shown as the sharp turn in the graph. We have a problem of scale, and of needing to shift the scale to see the results from afar, a need to go beyond magnifying and framing just a portion.
 Such exponential curves though are just a "slice of the pie", not the whole pie, they are a magnified segment of a larger scene. This can miscommunicate a certainty about unchecked growth and misrepresent the larger view of the reality of larger nature of nonlinear systems. The larger problem is that the smooth and simple exponential curves above are too misleading. Among sustained living systems, there is seemingly no real "end", just change. In reality, what goes up, must come down, and up, and down and the degree of change happens dependent on the degree of interaction in the system. The graph on left was created by the interesting properties of RX(1-X).
 It is also possible and useful to change perspective once again and now see the red-lined graph on the left as if above a basketball floor, representing the movement of the ball across the floor. The behavioral patterns of creativity have more to do with the artful dodging of basketball players running the ball down the floor to a goal. The more interesting, creative and valuable the system, the more the concept of an average as useful data is a lie, a severe distortion of reality and largely devoid of predictable power.
Perhaps it is helpful to think of it in a very personal way. If we apply that linear logic to classroom grading, we've been misrepresenting our species for a very long time. Or looked at another way, to the extent that a grade average represents the reality of a person's performance, straight A's or straight F's both raise questions about learning and imply a failure to work within Vygotsky's optimal zones of learning. Such consistent scores should be read as the absence of a successful setting for the learner to reach the full capacity of what it means to be a creative human being. The middling C average amidst widely fluctuating grades may represent the most promising learner of all. Creativity requires quite of a bit of experimenting.
There are other intuitions and metaphors we could lift in praise. We say to skiers that if you have stopped falling down you have stopped learning. Edison required a long line of failures in order to find success with his lightbulb. Try finding value in calculating Edison's average.
Whether considering the optimal behavior of people or social and biological systems, or the physical universe around us, nonlinear behavior dominates. To better appreciate the many trends driving 21st century life (Houghton, 2013) , it will be to our long term benefit to give proper respect to the deep nonlinear and consequently unpredictable behavior that dominates our world.
With such respect comes a deep understanding of the value of creativity in responding to and adding value to such a culture.


Comments